
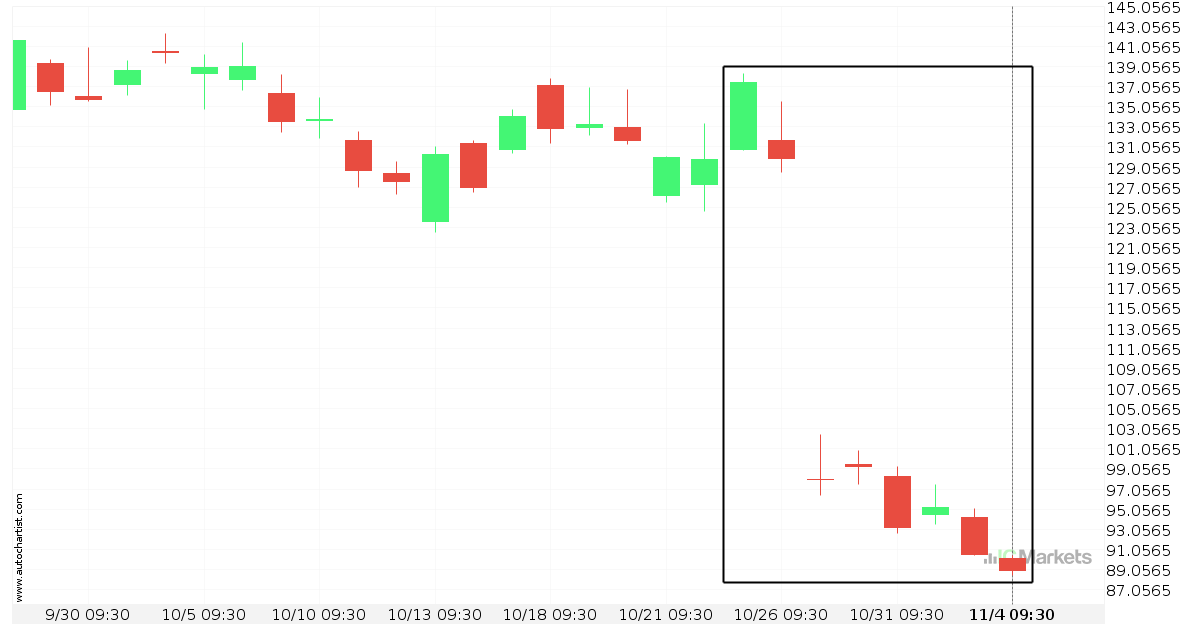
Huge bearish move on Meta Platforms, Inc. – Class A Common Stock
Meta Platforms, Inc. – Class A Common Stock has moved lower by 35,33% from 137.46 to 88.9 in the last 11 days.
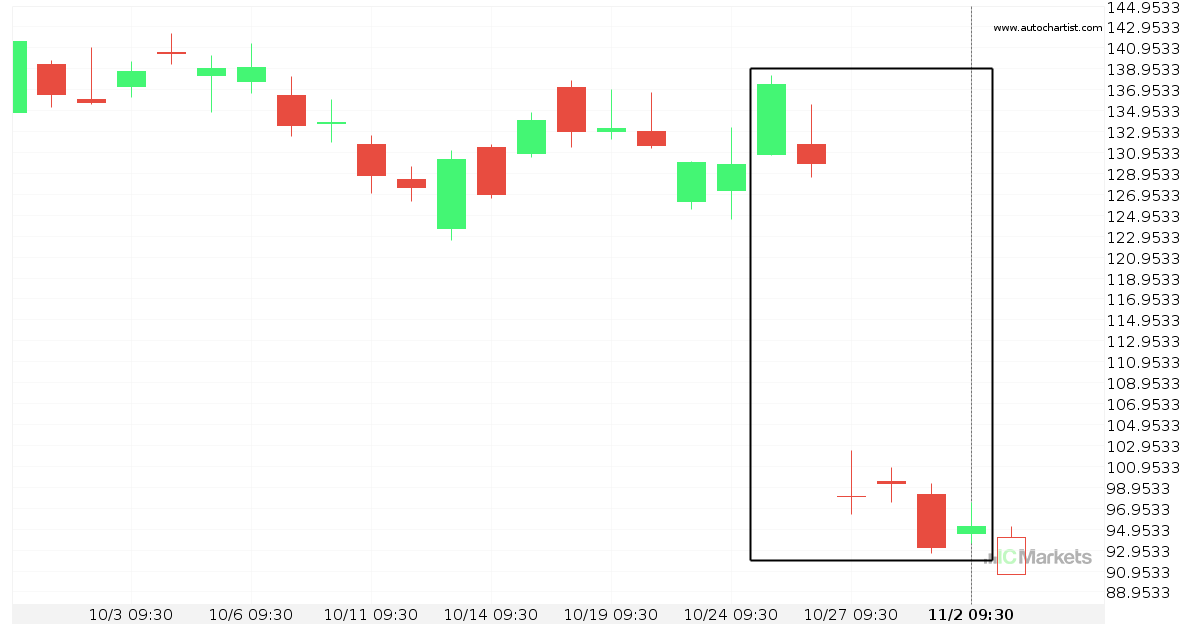
Huge bearish move on Meta Platforms, Inc. – Class A Common Stock
Meta Platforms, Inc. – Class A Common Stock has moved lower by 30,74% from 137.46 to 95.2 in the last 9 days.
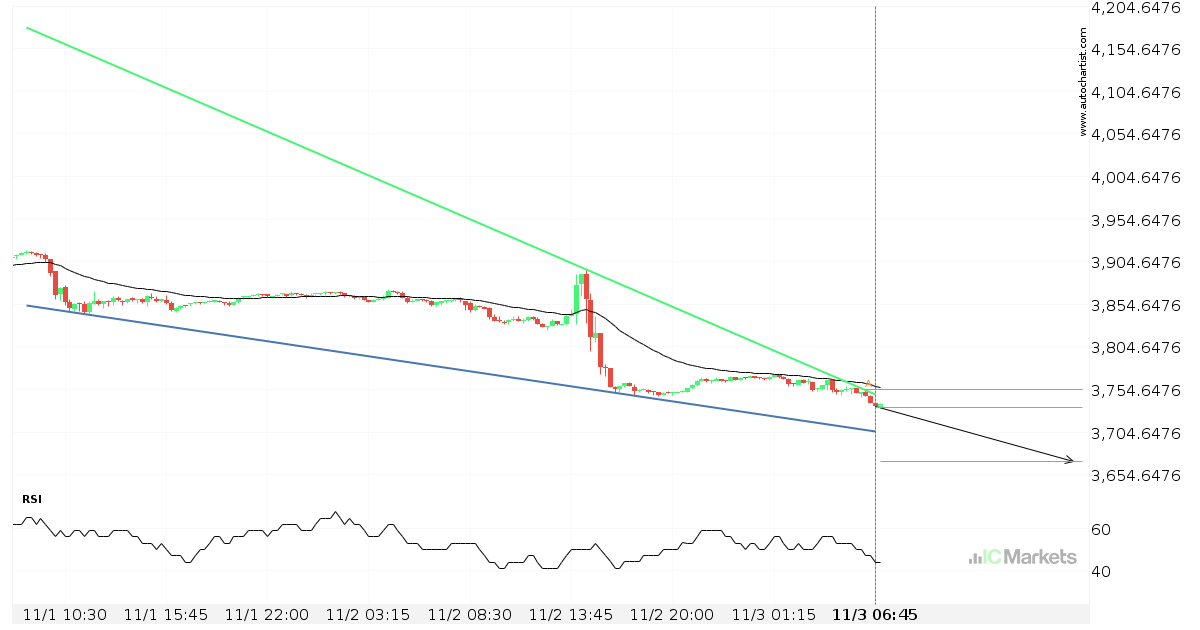
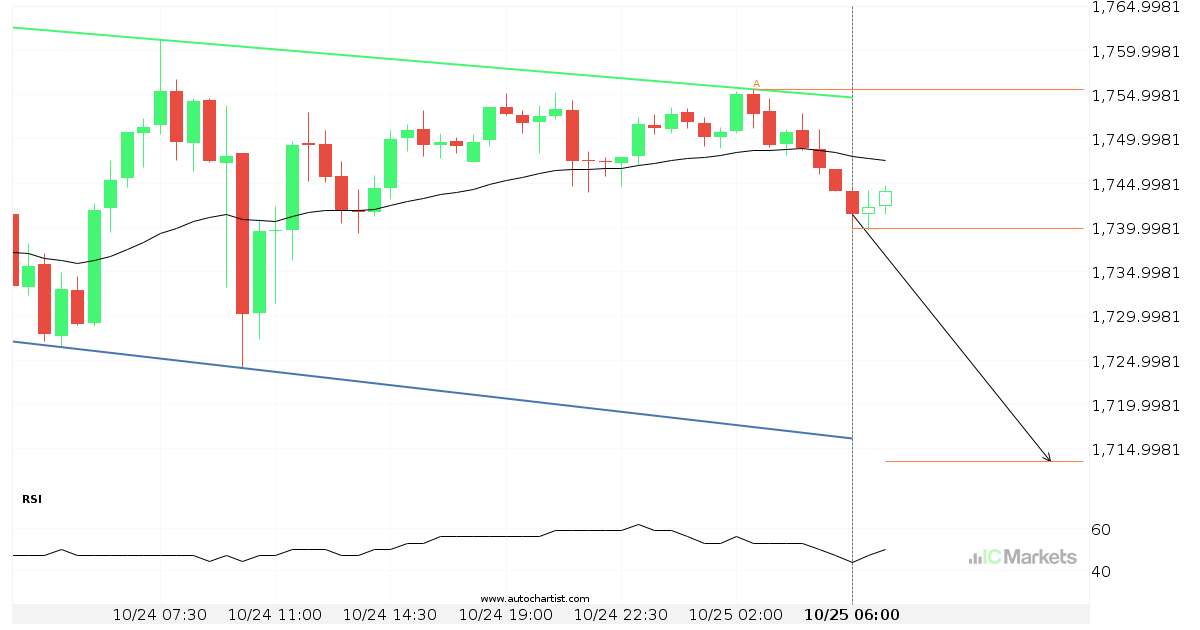
US SPX 500 Index approaching support of a Cunha descendente
US SPX 500 Index is approaching the support line of a Cunha descendente. It has touched this line numerous times in the last 2 days. If it tests this line again, it should do so in the next 13 hours.
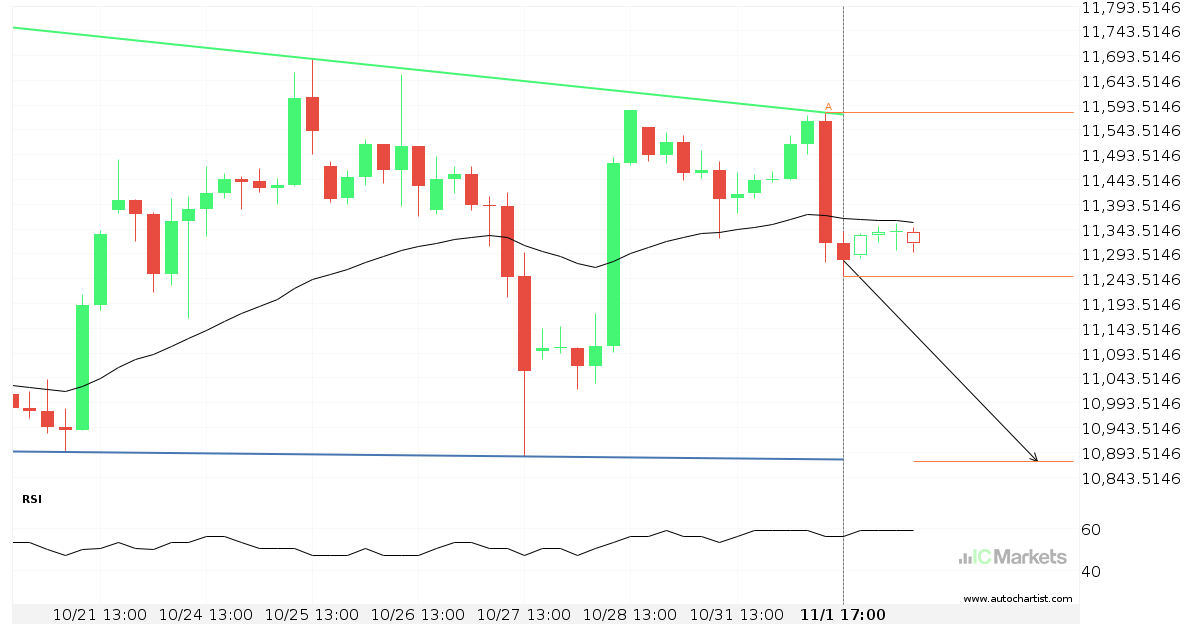
US Tech 100 Index approaching support of a Triângulo Descendente
US Tech 100 Index is approaching the support line of a Triângulo Descendente. It has touched this line numerous times in the last 15 days. If it tests this line again, it should do so in the next 2 days.
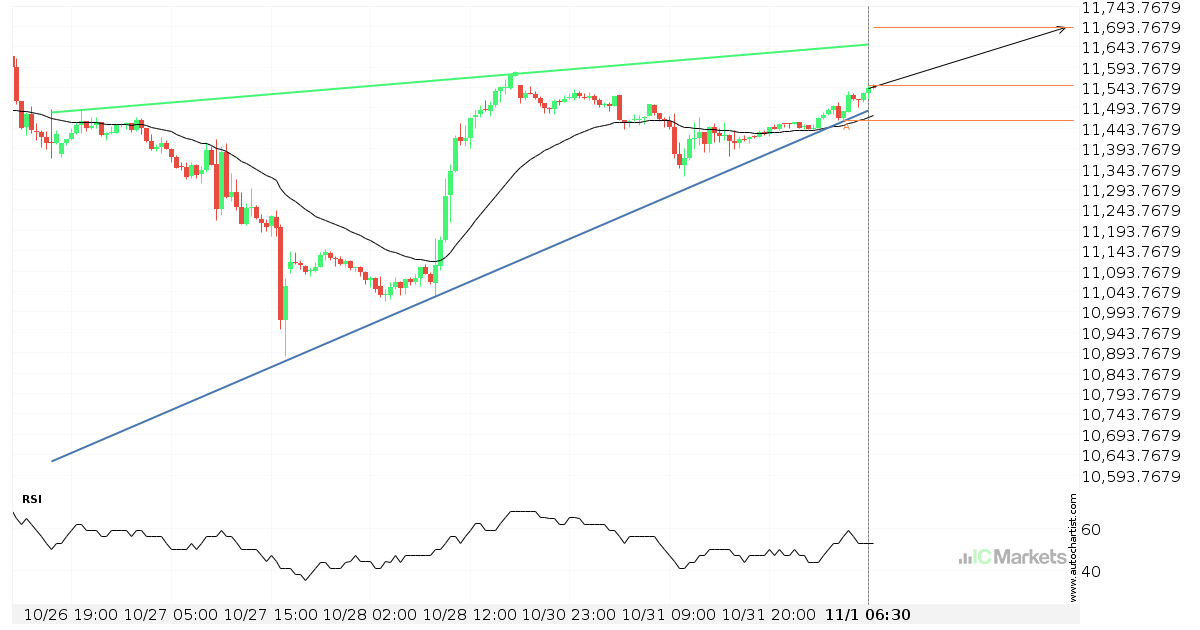
Will US Tech 100 Index have enough momentum to break resistance?
US Tech 100 Index is heading towards the resistance line of a Cunha ascendente and could reach this point within the next 2 days. It has tested this line numerous times in the past, and this time could be no different from the past, ending in a rebound instead of a breakout. If the breakout […]
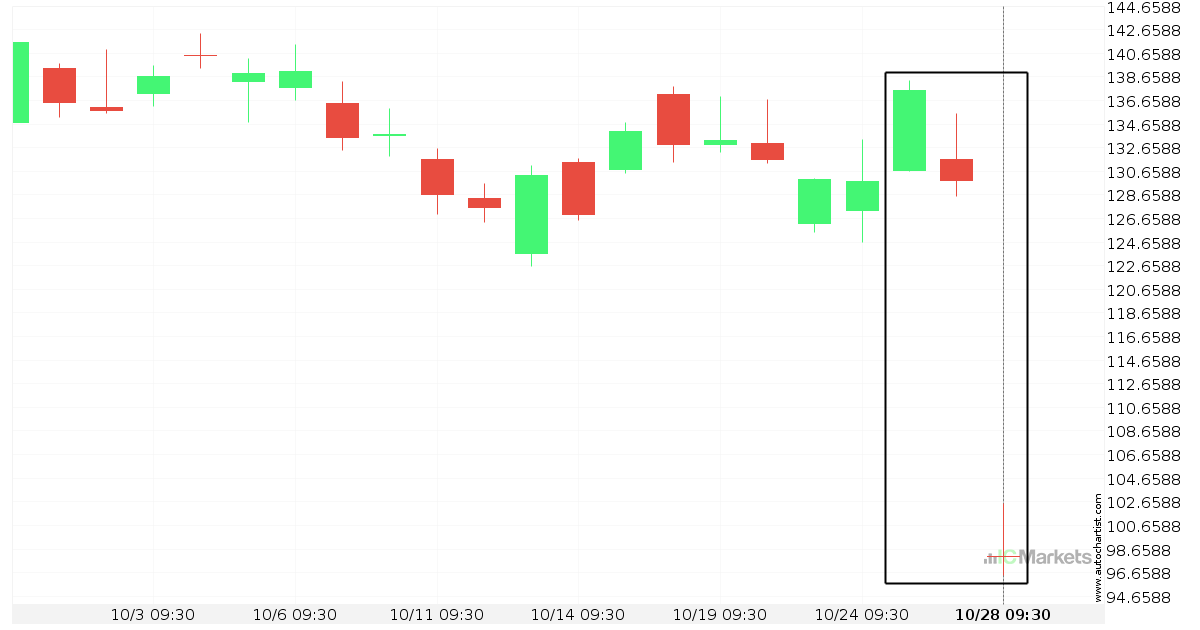
Meta Platforms, Inc. – Class A Common Stock is on its way down
Meta Platforms, Inc. – Class A Common Stock has experienced an exceptionally large movement lower by 28,74% from 137.46 to 97.955 in the last 4 days.
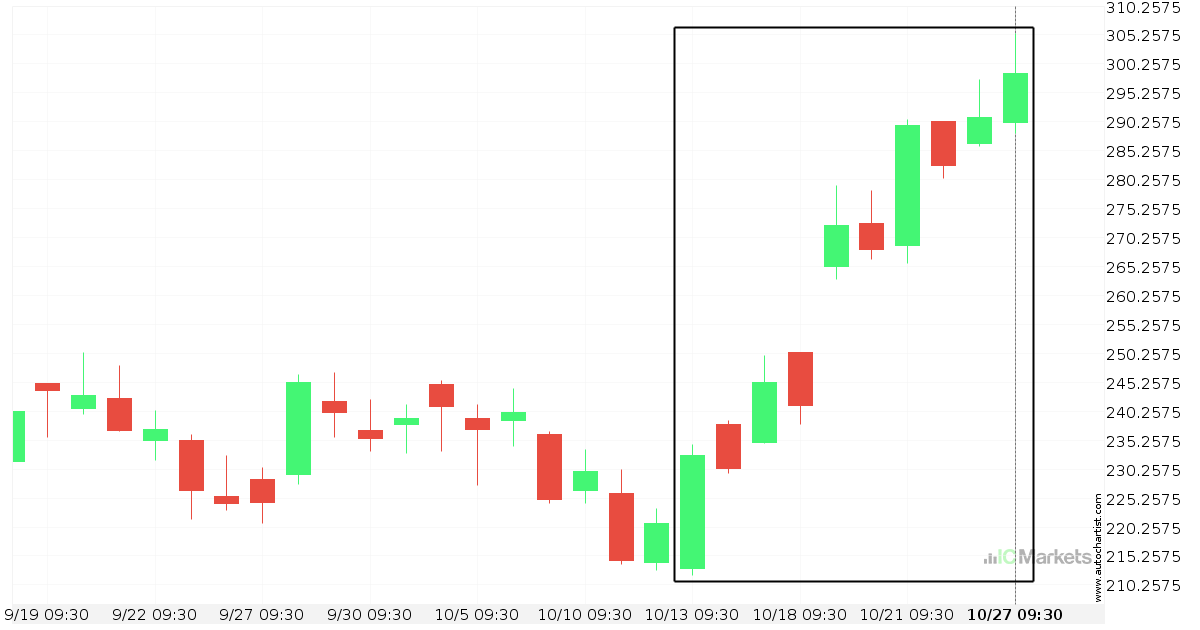
Huge bullish move on Netflix Inc.
Netflix Inc. has moved higher by 28,42% from 232.53 to 298.61 in the last 15 days.
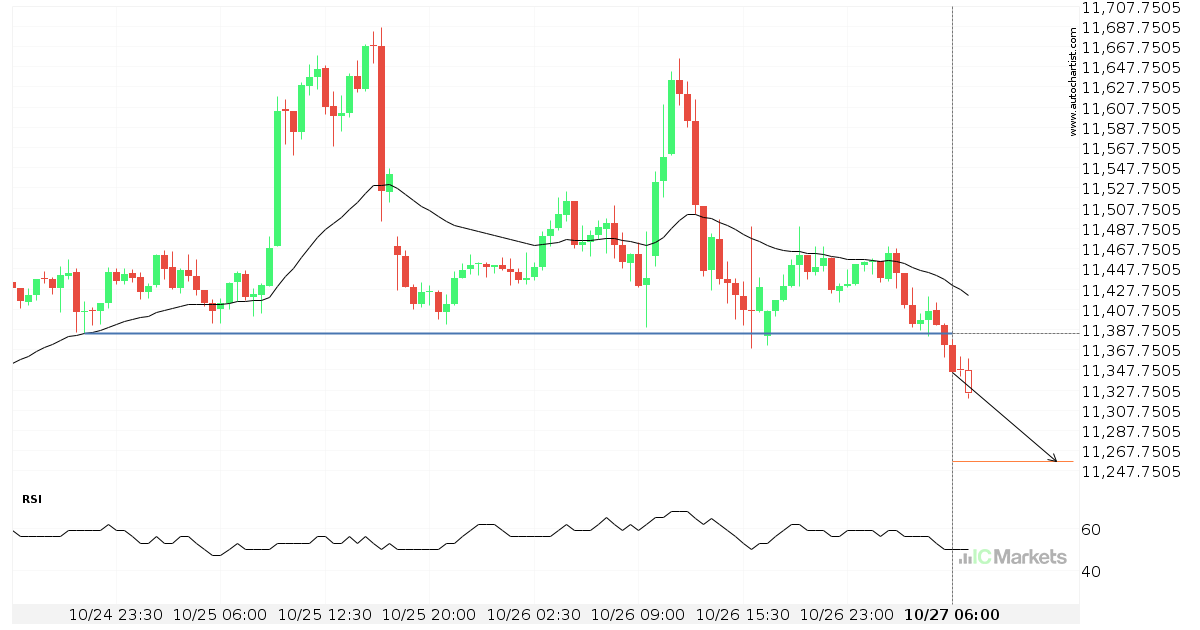
Important price line breached by US Tech 100 Index
US Tech 100 Index has broken through 11384.0000 which it has tested numerous times in the past. We have seen it retrace from this price in the past. If this new trend persists, US Tech 100 Index may be heading towards 11257.2900 within the next 12 hours.
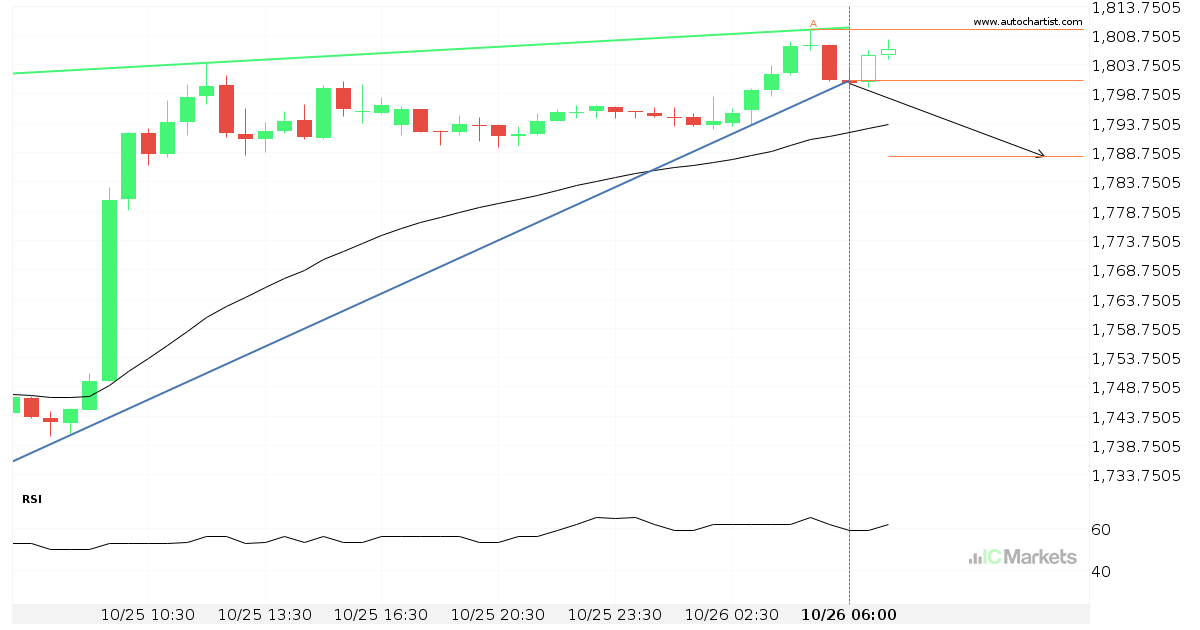
A possible start of a bearish trend on US Small Cap 2000 Index
US Small Cap 2000 Index has broken through a support line of a Cunha ascendente chart pattern. If this breakout holds true, we may see the price of US Small Cap 2000 Index testing 1788.0672 within the next 5 hours. But don’t be so quick to trade, it has tested this line in the past, […]
Possible breach of support level by US Small Cap 2000 Index
US Small Cap 2000 Index is moving towards a support line which it has tested numerous times in the past. We have seen it retrace from this line before, so at this stage it isn’t clear whether it will breach this line or rebound as it did before. If US Small Cap 2000 Index continues […]